General Reports
The Reports section contains general reports that analyze and track all customer, supplier, and technician activity.
- To learn more about using the Customer Relationship Man., see Sending Messages to Customers.
- For additional reporting options, see Overview of Reports.
To find Reports:
Click Reports >> select a report.

Work History Report
Local Tab: View and print previous invoices, and copy work from previous invoice to a new Work documents.
myCARFAX tab: View myCARFAX Service History based on VIN.
Local tab
Enter a License >> select a state from the drop-down menu >> click Display.
- Note: To search all vehicles of a specific make, enter a vehicle make in the License search field >> click Find. (Example: Honda)
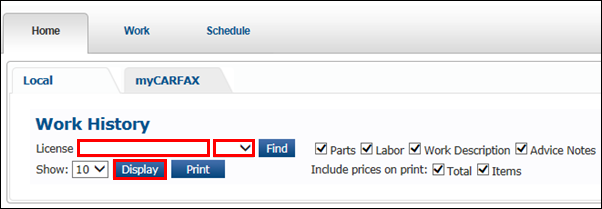
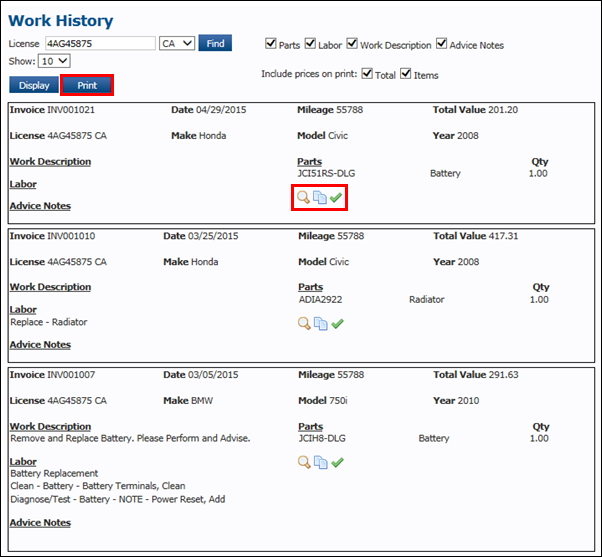
- A list of invoices will display.
- Invoices can be viewed and printed, or you can copy parts and labor to send to the current work document.
- Click Print to print the entire Work History of the vehicle.
myCARFAX tab
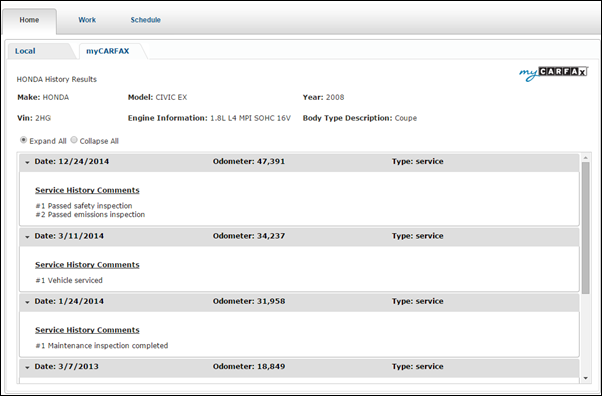
- Click myCARFAX >> enter the VIN >> click Search.
- Note:If a customer has already been selected, their VIN (Vehicle Identification Number) will automatically appear in the search fields, if available.

- The myCARFAX Service History will display.
Communications
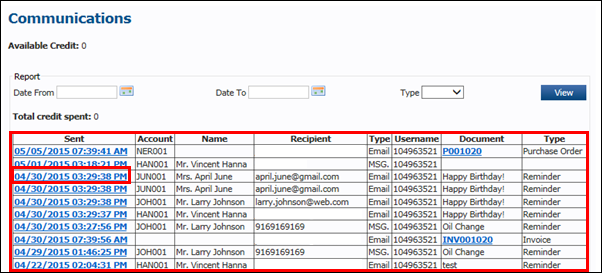
View all messages sent to customers through the Customer Relationship Manager. The reports displays the user, recipient, date, time, and type of message sent.
- To better filter results, enter as much information as available >> click View.

- On the list of messages, click the blue date and time in the Sent column to display the message that was sent.
Analysis Reports
Use these reports to manage your shop more effectively.
Business Analysis
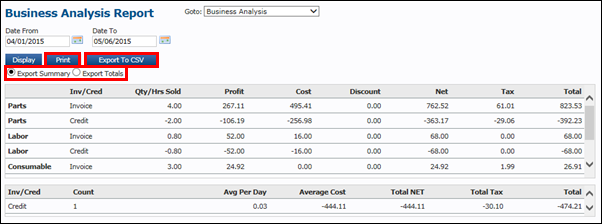
From a selected date range, shows totals and averages of Parts, Labor, Inspection, Consumables, and Miscellaneous items.
- Enter a Date From and Date To >> click Display.
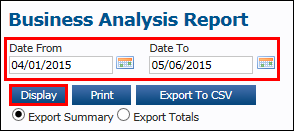
- Totals and Averages are displayed.
- Click Print to print the list of results, or click Export to CSV to save a copy of the report that can be read using Excel.
- When clicking Export to CSV, you may also select to Export Summary or Export Totals.
Custom Job Analysis
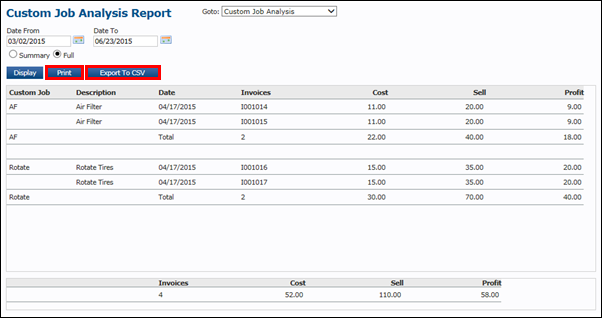
Displays each Custom Job used and the amount of invoices associated with the each job. Shows the financial impact on the shop of each custom job.
- Enter a Date From and Date To >> click Display.
- Select Summary or Full to display a summarized or full report.

- The Custom Job Analysis Report is displayed.
- Click Print to print the report, or click Export to CSV to save a copy of the report that can be read using Excel.
Customer Turnover
Displays every customer within a selected date range, showing the amount of Invoices, Average Cost, Total Value, Profit and Margin percentage of each customer.
Enter a Date From and Date To >> click Display.
- Select only a Customer Type to display customer types.
- Select Summary or Full to display a summarized or full report.

- Customer Turnover Report is displayed.
- Click Print to print the report, or click Export to CSV to save a copy of the report that can be read using Excel.

Good Better Best Report
Displays a breakdown of Good Better Best Job selections by ticket and can be filtered by Job Category or by Service Writer.
Enter a Date From and Date To >> click Display.
- Select a Category and/or Service Writer to further filter your results.

- The Good Better Best Report is displayed.
- Click Print to print the report, or click Export to CSV (Summary) or Export to CSV (Detailed) to save a copy of the report that can be read using Excel.

Inspection Report
Displays inspections by Labor Code, Customer Type and Inspector from a selected date range.
Enter a Date From and Date To >> click Display.
- Select a Labor Code, Cust Type or Inspector to better filter results.

- The Inspection Report is displayed.
- Click Print to print the report, or click Export to CSV to save a copy of the report that can be read using Excel.

Inspection Technicians
Lists each Inspection Technician, and the inspections each technician has completed.
Enter a Date From and Date To >> click Display.
- Check the Only Show Totals check box to only see the total inspections for each technician.

- Technicians and Inspections are displayed.
- Click Print to print the report, or click Export to CSV to save a copy of the report that can be read using Excel.

Invoice Item Margin Report
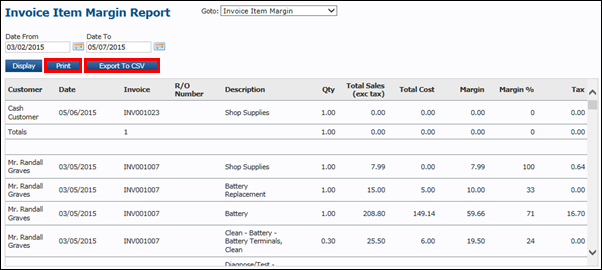
View margins associated with each invoice within a selected date range. Includes cost and sales tax.
- Enter a Date From and Date To >> click Display.

- The Invoice Item Margin Report is displayed.
- Click Print to print the report, or click Export to CSV to save a copy of the report that can be read using Excel.
Labor Analysis
Displays labor codes, and the amount of invoices utilizing each code. Cost and sell price, and profit by labor code is also displayed.
Enter a Date From and Date To >> click Display.
- Select a Technician to view Labor Analysis by technician.
- Select Summary or Full to display a summarized or full report.

- The Labor Analysis Report is displayed.
- Click Print to print the report, or click Export to CSV to save a copy of the report that can be read using Excel.

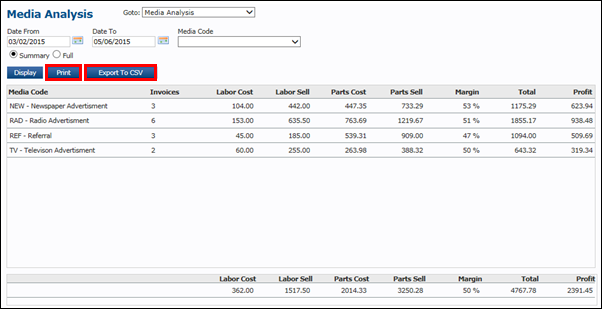
Media Analysis
Displays each Media Code and the amount of invoices associated with the each code. Shows the financial impact on the shop of each medium.
Enter a Date From and Date To >> click Display.
- Select a Media Code to better filter results.
- Select Summary or Full to display a summarized or full report.

- The Media Analysis Report is displayed.
- Click Print to print the report, or click Export to CSV to save a copy of the report that can be read using Excel.
Parts Profit
Lists each part sold within a date range showing the Profit and Margin on each part.
Enter a Date From and a Date To >> select to display All parts, Stocked Parts or Non-Stocked Parts >> click Display.
- Select an Account Code to further filter the results.

- The Parts Profit Report is displayed.
- Click Print to print the report, or click Export to CSV to save a copy of the report that can be read using Excel.

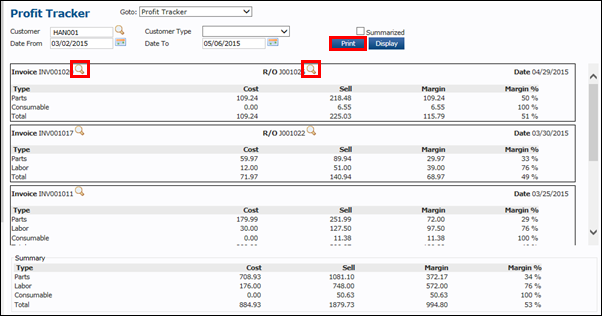
Profit Tracker
Breaks down each invoice within a selected date range, to a dollar amount of Cost price, Sell price, Margin amount and Margin percentage.
Enter or search for a Customer ID >> enter a Date From and Date To >> click Display.
- Select only a Customer Type to display customer types.
- Select the Summarized check box to view totals only.

- Results are displayed.
- Click the magnifying glass next to the Invoice and R/O number to view and print those documents.
- Click Print to print the report.
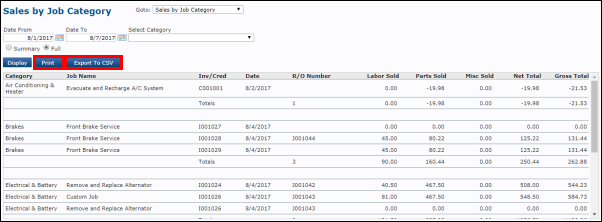
Sales by Job Category
Displays each Job Category and the amount of invoices/credits and repair orders associated with the each category. Shows the Labor, Parts, Misc, Net and Gross Total from each Service Writer.
- Enter a Date From and Date To >> click Display.
- Select a Category to better filter results.
- Select Summary or Full to display a summarized or full report.

- The Sales by Job Category Report is displayed.
- Click Print to print the report, or click Export to CSV to save a copy of the report that can be read using Excel.
Sales by Service Writer
Displays each Service Writer and the amount of invoices/credits and repair orders associated with the each writer. Shows the Labor, Parts, Misc, Net and Gross Total from each Service Writer.
- Enter a Date From and Date To >> click Display.
- Select a Service Writer to better filter results.
- Select Summary or Full to display a summarized or full report.

- The Sales by Service Writer Report is displayed.
- Click Print to print the report, or click Export to CSV to save a copy of the report that can be read using Excel.

Technicians Work
Displays invoices and credits, showing the amount of Hours Sold, Value Sold, and Profit, by each technician.
Enter a Date From and Date To >> Select check boxes if you wish to display Labor, Inspection or Parts >> click Display.
- Select Primary Technicians or QC Technicians to display either type of technician.
- Select Summary or Full to display a summarized or full report.

- Technicians and totals are displayed.
- Click Print to print the list of results, or click Export to CSV to save a copy of the report that can be read using Excel.

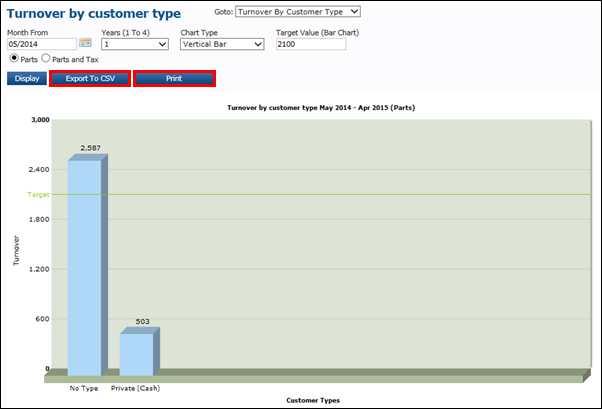
Turnover By Customer Type
Displays turnover for each customer pay type. Display up to four years per each selectable date range.
Enter a Month From >> select a number of Years (1 to 4) to view >> select a Chart Type >> click Display.
- Enter a Target Value (Bar Chart) to display a green line on the bar chart that will help visualize your goal on the chart.
- Select Parts to display parts totals only, or Parts and Tax to display parts and tax totals only.

- Chart is displayed.
- Click Print to print the chart, or click Export to CSV to save a copy that can be read using Excel.
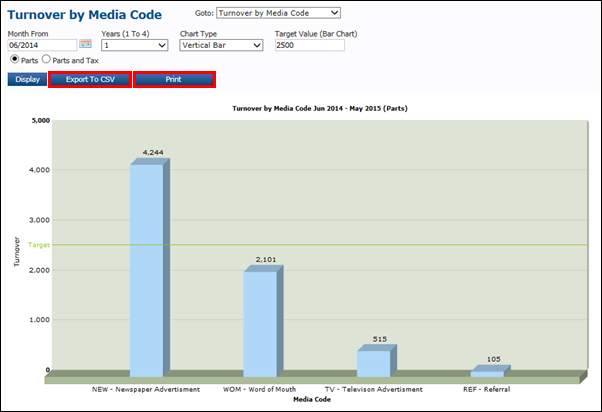
Turnover by Media Code
Displays the turnover of each Media Code used within the date range. Select from various chart types to view turnover.
- Enter a Month From >> select a number of Years (1 to 4) to view >> select a Chart Type >> click Display.
- Enter a Target Value (Bar Chart) to display a green line on the bar chart that will help visualize your goal on the chart.
- Select Parts to display parts totals only, or Parts and Tax to display parts and tax totals only.

- Chart is Displayed.
- Click Print to print the chart, or click Export to CSV to save a copy that can be read using Excel.
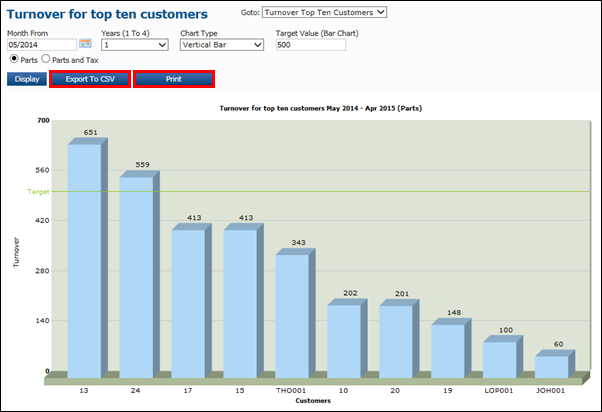
Turnover Top Ten Customers
Select a date range to graphically display your Top Ten Customers and their expenditures at your shop on a variety of chart type graphs.
Enter a Month From >> select a number of Years (1 to 4) to view >> select a Chart Type >> click Display.
- Enter a Target Value (Bar Chart) to display a green line on the bar chart that will help visualize your goal on the chart.
- Select Parts to display parts totals only, or Parts and Tax to display parts and tax totals only.

- Chart is displayed.
- Click Print to print the chart, or click Export to CSV to save a copy that can be read using Excel.
Value of Recovered Work
Displays each Job Category and Deferred Reason. This includes the amount of invoices/credits and repair orders associated with the each category as well as Net and Gross Total.
- Enter a Date From and Date To >> click Display.
- Select a Category, Deferred Reason, or who the invoice was deferred by to better filter results.

- The Value of Recovered Work Report is displayed.
- Click Print to print the report, or click Export to CSV to save a copy of the report that can be read using Excel.

Value of Suggested Work
Displays each Job Category and Source of the Suggestion. This includes the amount of invoices/credits and repair orders associated with the each category as well as Net and Gross Total.
- Enter a Date From and Date To >> click Display.
- Select a Source to better filter results.

- The Value of Suggested Work Report is displayed.
- Click Print to print the report, or click Export to CSV to save a copy of the report that can be read using Excel.

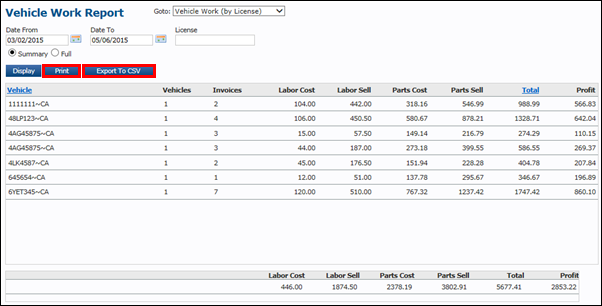
Vehicle Work (by License)
Displays invoices, cost amount and sell amount of labor and parts, and profit by vehicle license serviced in the shop over a selected date range.
Enter a Date From and Date To >> enter a License >> click Display.
- Enter no License to display all vehicle licenses.
- Select Summary or Full to display a summarized or full report.

- Vehicle Work (by License) Report is displayed.
- Click Print to print the report, or click Export to CSV to save a copy of the report that can be read using Excel.
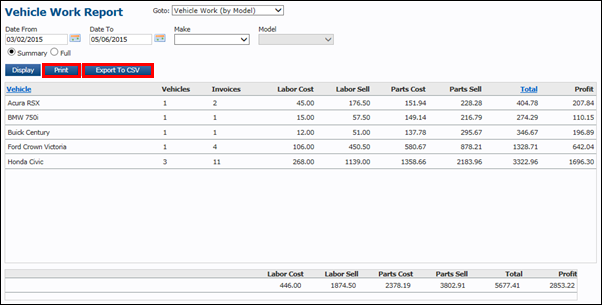
Vehicle Work (by Model)
Displays invoices, cost amount and sell amount of labor and parts, and profit by vehicle type serviced in the shop over a selected date range.
Enter a Date From and Date To >> select a Make and Model >> click Display.
- Make no Make or Model selection to display all vehicles.
- Select Summary or Full to display a summarized or full report.

- Vehicle Work (by Model) Report is displayed.
- Click Print to print the report, or click Export to CSV to save a copy of the report that can be read using Excel.
Supplier Spend
Displays amount of money spent with suppliers over a selected date range.
Enter a Date From and Date To >> click Display.
- Select a Supplier to only view expenditures with a selected supplier.
- Select Summary or Full to display a summarized or full report.

- The Supplier Spend Report is displayed.
- Click Print to print the report, or click Export to CSV to save a copy of the report that can be read using Excel.

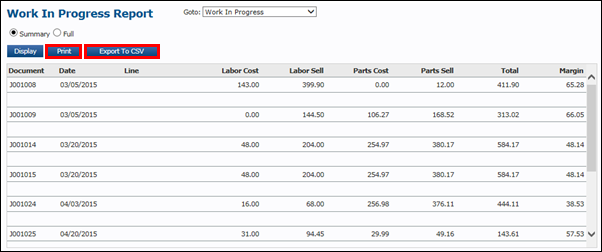
Work in Progress
Displays the date, cost amount and sell amount of labor and parts, totals, and margins by work documents that are not yet invoiced.
- Work In Progress Report will automatically display.
- Select Summary or Full to display a summarized or full report >> click Display.
- Click Print to print the report, or click Export to CSV to save a copy of the report that can be read using Excel.
Yearly Profit
Displays up to four years of profit, by month, on a variety of chart type graphs.
Enter a Month From >> select a number of Years (1 to 4) to view >> select a Chart Type >> click Display.
- Enter a Target Value (Bar Chart) to display a green line on the bar chart that will help visualize your goal on the chart.

- Chart is displayed.
- Click Print to print the chart, or click Export to CSV to save a copy that can be read using Excel.

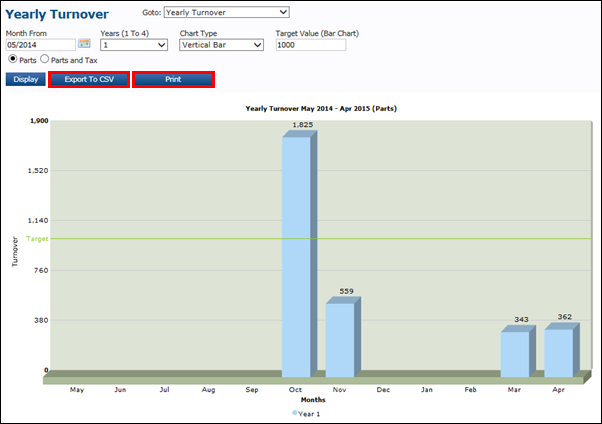
Yearly Turnover
Displays Yearly Turnover of Parts or Parts and Tax. Select a date range in four year intervals, and select from various chart types to view turnover.
Enter a Month From >> select a number of Years (1 to 4) to view >> select a Chart Type >> click Display.
- Enter a Target Value (Bar Chart) to display a green line on the bar chart that will help visualize your goal on the chart.
- Select Parts to display parts totals only, or Parts and Tax to display parts and tax totals only.

- Chart is displayed.
- Click Print to print the chart, or click Export to CSV to save a copy that can be read using Excel.
Vehicles On Site
View list of vehicles and their Key Tags that are marked On Site.
- Click the Key Tag icon to view the key tag number for each vehicle.
- See Code Settings - Key Tag to learn more.
- Click the red On Site button to mark the vehicle Off Site.
- Click Print to view and print a list of all vehicles on site.

Authorization Required Report
View all work documents that require authorization from the owner to proceed with the work on the vehicle.
- Select Estimate or R/O >> click Display.

- Results are displayed.
- Estimates or R/O's can be selected, viewed and printed.
- Click Print to print the entire list.

Technician Tracking
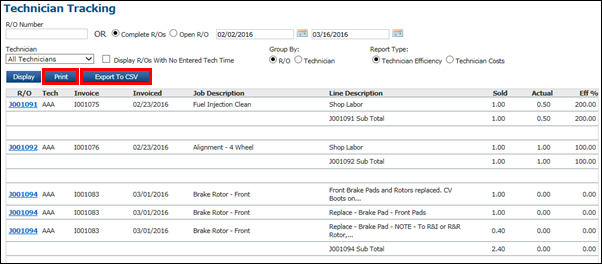
View all Technicians' Sold Hours, Actual Hours, and Efficiency percentage by Complete or Open R/Os.
To view the report
- Select Complete or Open R/Os >> select a date range >> select the Technician to view >> select to group jobs by R/O or Technician >> select Technician Efficiency (Time Tracking) or Technician Costs >> click Display.
- Notes:
- Type a document number in the R/O field to search for a specific Repair Order.
- Example: J001094
- Click Display Jobs With No Entered Tech Time to view jobs with no tracked technician time.
- Type a document number in the R/O field to search for a specific Repair Order.
- Notes:

- Results are displayed.
- Click Print to print the report.
- Click Export to CSV to save a copy of the report that can be read using Excel.
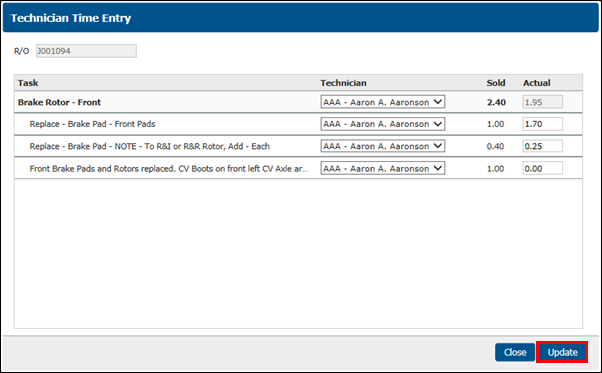
To edit Technicians' Time
- Click the Document number for the labor line(s) you want to edit.
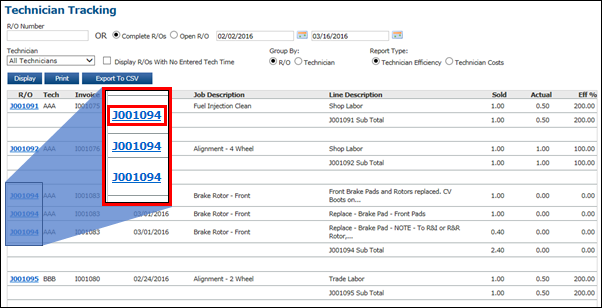
- Make the necessary edits >> click Update.
- Note: To learn how to restrict who can edit Technician's time after the Repair Order is complete, see Code Settings - Technicians.

